Ingentis org.manager add-on

Big Data: Understand complex Org Data through interactive Visualizations

Why choose the Big Data add-on

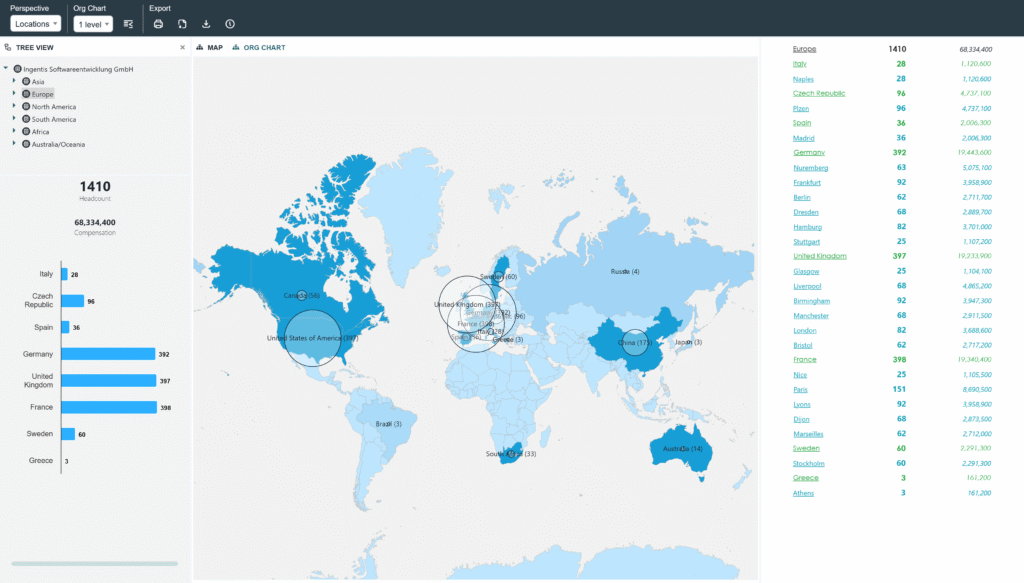
With the Big Data add-on, you’ll visualize large and complex Org & People data sets for insights at a glance. You’ll go beyond hierarchies and discover relationships, networks and patterns that remain hidden in legacy org charts. You’ll quickly spot clusters, dependencies and anomalies within your organization – and create the foundation for data-driven decisions.

Key Benefits

  • Quickly grasp complex interdependencies and network structures
  • Transparency of organizational developments over time (time slices)
  • Deeper insights into complex relationships, clusters and critical nodes
  • Compare international structures and KPIs across regions & countries
  • Alternative views beyond classic organizational charts
  • Deploy with flexibility for various org and data models

Features & Functions

Structuring complex relationship landscapes

The big data diagram condenses complex organizational, role or skill landscapes into clearly structured visualizations. Relationships, clusters and correlations are presented in such a way that even complex structures can be quickly understood.

Interactive relationship cards

Complex relationships, matrix structures, project assignments, communities or committees are mapped as relationship networks. Dependencies, clusters and critical nodes can be recognized at a glance.

Regional & international structures

Global organizational structures are displayed on world maps. Evaluate KPIs by country, region or continent and quickly analyze specific differences.

Developments over time

Time slices show how organizations, teams or KPIs change across defined points in time. Easily compare developments, trends and structural changes.

High-performance processing of large amounts of data & complex models

The add-on is designed to process large amounts of data and complex models, enabling stable, interactive visualizations even with high structural complexity.

Multi-level highlighting

Several technical criteria can be highlighted simultaneously in representations such as sunburst or bubble charts – for example, critical roles, key people, skill clusters or organizational characteristics. Value ranges can be narrowed down in a targeted manner, for example using interactive sliders, in order to precisely analyze complex relationships even beyond geographical structures.

Smart Visuals, Powerful Insights

With the Big Data add-on, you can visualize complex organizational models, correlations and KPIs in a completely new way. Different types of diagrams help users to immediately recognize patterns, risks and potential – completely interactive, intuitive and data-driven.

The world map visualization lets you grasp regional structures, location clusters and international connections immediately. Colors, sizes and filters help to intuitively compare differences between countries and regions.
The time slice visualization shows how organizations, teams or key figures change over defined periods of time. Classify and evaluate developments, trends and events over time and based on data.
The sunburst chart offers an intuitive view of complex organizational structures. Hierarchy levels, teams and KPIs are brought together in a compact, easy-to-interpret visual so that deviations can be quickly identified.
Agile network visualizations depict relationships, responsibilities and collaboration patterns outside of traditional hierarchies. Informal networks, bottlenecks or key positions can thus be specifically identified.
Bubble charts visualize organizational units using freely definable key figures. Size ratios, capacity utilization or anomalies in the database are thus clearly comparable.
Treemap visualizations represent structures on an area basis and illustrate ratios, budget ratios or segment distributions. They are particularly suitable for analyses at department or division level in large organizations.

Typical Application Scenarios

Matrix & Project OrganizationsCompetence & Proficiency DiagramsPeople & Workforce AnalyticsOrg-Design & TransformationStakeholder Reporting
Ingentis Platform Software Screens

All add-ons for Ingentis org.manager

Solutions for the most common HR and Org needs

Big Data is just one of several add-ons for Ingentis org.manager. Find more add-ons in our overview.

Request your free demo now!